Too many organizations rely heavily on failure data to monitor performance, so improvements or changes are only determined after something has gone wrong. Discovering weaknesses in control systems by having a major incident is too late and too costly. Early warning of dangerous deterioration within critical systems provides an opportunity to avoid major incidents. Knowing that process risks are effectively controlled has a clear link with business efficiency, as several safety indicators can be used to show plant availability and optimized operating conditions. This guidance is aimed at senior managers and safety professionals within major hazard organizations that wish to develop performance safety indicators to give improved assurance that major hazard risks are under control.
Also Read: Key Risk Indicators ( KRIs) and it’s the relationship to Key Performance Indicators (KPIs )
Introduction- Measurement leads to confidence
Too many organizations rely heavily on failure data to monitor performance. The consequence of this approach is that improvements or changes are only determined after something has gone wrong. Often the difference between whether a system failure results in a minor or a catastrophic outcome is purely down to chance. Effective management of major hazards requires a proactive approach to risk management, so information to confirm critical systems are operating as intended is essential. Switching the emphasis in favor of leading indicators to confirm that risk controls continue to operate is an important step forward in the management of major hazard risks.
The main reason for measuring process safety performance is to provide ongoing assurance that risks are being adequately controlled. Directors and senior managers need to monitor the effectiveness of internal controls against business risks. For major hazard installations and chemical manufacturers, process safety risks will be a significant aspect of business risk, asset integrity, and reputation. Many organizations do not have good information to show how well they are managing major hazard risks. This is because the information gathered tends to be limited to measuring failures, such as incidents or near misses. Discovering weaknesses in control systems by having a major incident is too late and too costly. Early warning of dangerous deterioration within critical systems provides an opportunity to avoid major incidents. Knowing that process risks are effectively controlled has a clear link with business efficiency, as several indicators can be used to show plant availability and optimized operating conditions.
Also Read: Overview of Lost Time Incident Rate and its Calculator
The method of setting indicators outlined in this article requires those involved in managing process safety risks to ask some fundamental questions about their systems, such as:
■ What can go wrong?
■ What controls are in place to prevent major incidents?
■ What does each control deliver in terms of a ‘safety outcome’?
■ How do we know they continue to operate as intended?
Companies who have adopted process safety performance indicators have reported that they have:
■ an increased assurance of risk management and protected reputation;
■ demonstrated the suitability of their risk control systems;
■ avoided discovering weaknesses through costly incidents;
■ stopped collecting and reporting performance information that was no longer relevant – thereby saving costs; and
■ made better use of information already collected for other purposes, eg quality management.
Measuring performance – early warning before catastrophic failure
Most systems and procedures deteriorate over time, and system failures discovered following a major incident frequently surprise senior managers, who sincerely believed that the controls were functioning as designed. Used effectively, process safety indicators can provide an early warning, before catastrophic failure, that critical controls have deteriorated to an unacceptable level.
Measuring performance to assess how effectively risks are being controlled is an essential part of a health and safety management system, as explained in Successful health and safety management, and, for example, the CIA’s Responsible Care Management Systems:
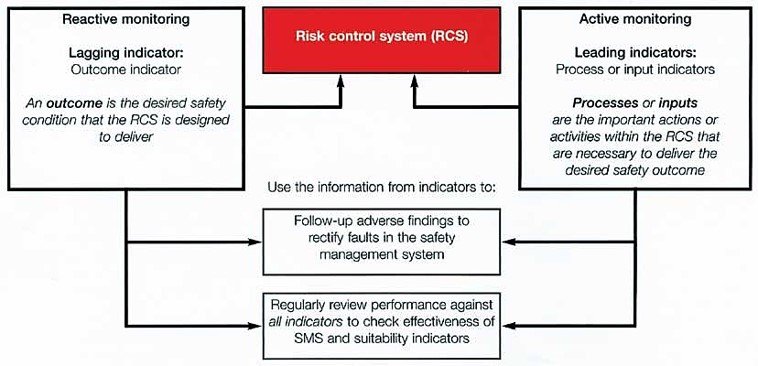
■ active monitoring provides feedback on performance before an accident or incident; whereas
■ reactive monitoring involves identifying and reporting incidents to check the controls in place are adequate, to identify weaknesses or gaps in control systems, and to learn from mistakes.
What’s different about this guide?
Dual assurance – a leading and lagging indicator for each risk control system
The main difference between the approach outlined in this guide and existing guidance on performance measurement is the introduction of the concept of ‘dual assurance’ that key risk control systems are operating as intended. Leading and lagging indicators are set in a structured and systematic way for each critical risk
control system within the whole process safety management system. In tandem, they act as system guardians providing dual assurance to confirm that the risk control system is operating as intended or providing a warning that problems are starting to develop.
Leading indicators
Leading indicators are a form of active monitoring focused on a few critical risk control systems to ensure their continued effectiveness. Leading indicators require a routine systematic check that key actions or activities are undertaken as intended. They can be considered as measures of process or inputs essential to deliver the desired safety outcome.
Also Read: E-Books: Leading Indicators for Workplace Health and Safety
Lagging indicators
Lagging indicators are a form of reactive monitoring requiring the reporting and investigation of specific incidents and events to discover weaknesses in that system. These incidents or events do not have to result in major damage or injury or even a loss of containment, providing that they represent a failure of a significant control system that guards against or limits the consequences of a major incident. Lagging indicators show when a desired safety outcome has failed, or has not been achieved.
According to James Reason in Managing the Risks of Organizational Accidents, (major) accidents result when a series of failings within several critical risk control systems materialize concurrently. Figure 2 illustrates an ‘accident trajectory’ model where an accident trajectory passes through corresponding holes in the layers of defense, barriers, and safeguards. Each risk control system represents an important barrier or safeguards within the process safety management system. It should also be recognized that a significant failure in just one critical barrier may be sufficient in itself to give rise to a major accident.
For each risk control system:
■ the leading indicator identifies failings or ‘holes’ in vital aspects of the risk control system discovered during routine checks on the operation of a critical activity within the risk control system; and
■ the lagging indicator reveals failings or ‘holes’ in that barrier discovered following an incident or adverse event. The incident does not necessarily have to result in injury or environmental damage and can be a near miss, precursor event, or undesired outcome attributable to a failing in that risk control system.
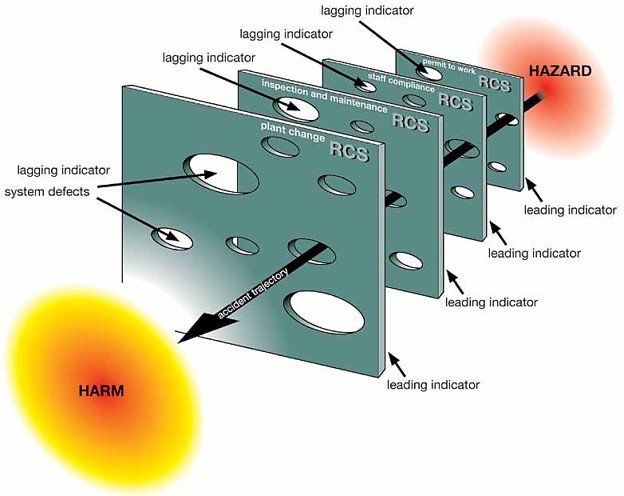
If unchecked, all systems will deteriorate over time and major incidents occur when defects across a number of risk control systems materialize concurrently. Setting leading and lagging indicators for each risk critical control system should reveal failings in these barriers as they arise and before all the important barriers are defeated.
Frequency of checks
Many organizations rely on auditing to highlight system deterioration. However, audit intervals can be too infrequent to detect the rapid change, or the audit may focus on compliance (verifying the right systems are in place), rather than ensuring systems are delivering the desired safety outcome. The use of process safety performance indicators fits between these formal, infrequent audits and more frequent workplace inspection and safety observation programs. It is important to bear in mind that an audit program may be designed to address different issues when compared to the information gained from performance indicators. Ideally, each will inform the other. Deficiencies uncovered by an audit may highlight the need for a new performance indicator and vice versa. Therefore, performance indicators are not a substitute for an audit program but a complimentary activity to give more frequent or different information on system performance.

Six steps to performance measurement
This section outlines the six main stages needed to implement a process safety measurement system. Organizations that do not have a process safety performance measurement system would benefit from considering each stage in turn. Organizations with performance measurement systems in place can use this guide as a benchmark of good practice and consider improvements as appropriate.
Step 1
Establish the organizational arrangements to implement the indicators
- Appoint a steward or champion
- Set up an implementation team
- Senior management should be involved
- Select the organizational level
New organizational arrangements may be needed to implement a performance measurement system. Someone will have to make the case for process safety measurement within the company and then drive it forward to implementation. The benefits and the costs will need to be carefully considered and the details of the exact indicators determined.
Step 2
Decide on the scope of the measurement system. Consider what can go wrong and where.
- Select the organizational level
- Identify the scope of the measurement system:
- identify incident scenarios – what can go wrong?
- Identify the immediate causes of hazard scenarios
- Review performance and non-conformances
Setting the scope is about selecting the right indicators to provide just enough information about the adequacy of process safety controls. Performance can be monitored at a number of organizational levels within a business and the information can be presented in a hierarchical manner. The nature of the indicators will vary depending on the organizational level at which they have been set. Indicators set for the whole organizational will, by their nature, tend to be more generic, whereas those set at the plant or site level will be more focused on key activities or processes and give more direct feedback on the functioning of those activities.
Tailor the indicators to suit the business
The management systems and activities of every organization are different and so the way performance indicators may be used will also differ from one organization to another. There is no right system to suit every need and many enterprises already have key performance indicators (KPIs) covering a number of business activities. It is important that new indicators covering process safety are integrated into and complement existing arrangements for monitoring business performance.
How many indicators? Quality not quantity
It is not necessary to measure every aspect or element of a process safety management system. Focusing on a few critical risk control systems will provide a sufficient overview of performance. Problems highlighted in one risk control system should trigger a more widespread review.
Busy management teams will quickly lose interest in an extensive raft of indicators, so it is essential to avoid KPI overload. Data collection and analysis is resource intensive, so arrangements for monitoring performance have to be cost-effective. Even for the largest organizations a few indicators set against the main risks will be sufficient to provide a high degree of assurance across the whole business.
Also Read: HSE Key Performance Indicators need to be Tracked
Step 3
Identify the risk control systems in place to prevent major accidents. Decide on the outcomes for each and set a lagging indicator
- What risk control systems are in place?
- Describe the outcome
- Set a lagging indicator
- Follow-up deviations from the outcome
If you don’t clearly identify the ‘desired safety outcome’ in terms of ‘success’, it will be impossible to identify indicators that show the desired outcome is being achieved
Step 4
Identify the critical elements of each risk control system, (ie those actions or processes which must function correctly to deliver the outcomes) and set leading indicators
- What are the most important parts of the risk control system?
- Set a leading indicator
- Set tolerances
- Follow-up deviations from tolerances
Leading indicators highlight whether the risk control systems in place to deliver the outcome are operating as designed.

Also Read: Evaluating the Effectiveness of Leading Indicators and Developing High-Impact for safety
Step 5
Establish the data collection and reporting system
- Collect information – ensure information/unit of measurement is available or can be established
- Decide on presentation format
Collection
Once the indicators have been selected and the tolerances set, it is important to ensure that the relevant information is readily available within the organization. Experience has shown that the information and data required to support a suite of process safety indicators is usually already available and collected for other purposes, eg for quality control or business efficiency. However, it is vital the data is collated to form a complete set of information on process safety risks.
Ideally, it is best to coordinate the performance data through one person who will be responsible for collecting all the information, compiling reports for the management team, and raising the alarm if there are any deviations from set tolerances.
Presentation
Keep the presentation of performance data as simple as possible – summarised in a single sheet. It is important to clearly show any deviations from set tolerances or targets and important trends. Graphs, charts, or ‘dashboards’ are probably the best way to show this. Alternatively, various systems such as traffic lights (green – ok, yellow – slight deviation, red – large deviation) or ‘smiley/sad faces’ (see Table 2) can be used to highlight where you are doing well/badly.
The senior management team should regularly receive key performance information. They are the main customers for this information and will need to make decisions on corrective action. There may be a hierarchy of indicators in place, each needing to be collated separately.
Present the data to clearly show the link between the lagging indicator (including the degree of success against outcome) and the leading indicator(s) relating to the supporting risk control systems. This will clearly highlight the cause-and-effect links between them.
Although the presentation of data is important, the data collected is worthless unless it is actually used to improve health and safety.
Step 6
Review
- Review the performance of the process management system
- Review the scope of the indicators
- Review the tolerances
Review the performance of the process safety management system
Performance against each risk should be routinely reviewed by senior managers to ensure that the whole process safety management system is delivering the intended outcomes and to provide assurance that critical systems continue to operate as intended.
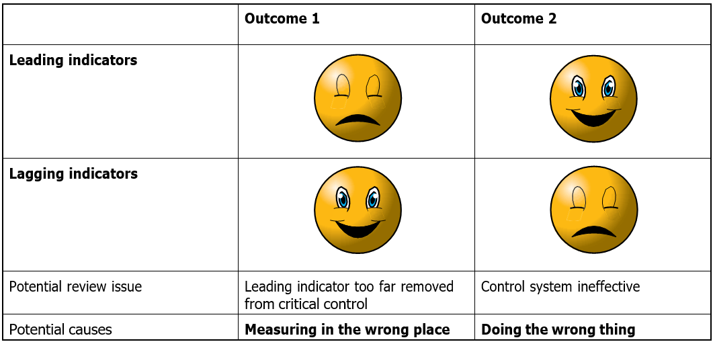
Variation in performance between leading and lagging indicators
If performance is poor against a group of leading indicators but the associated lagging indicator is satisfactory, it is likely that the leading indicators selected
are too far removed from the critical control measure that delivers or maintains the desired outcome. For instance, the percentage of induction training completed may be measured, whereas more importantly, training and competence in a particular process activity may be more critical to ensuring the safety of that specific activity.
If a group of leading indicators is on target and closely linked to the risk control system but the associated lagging indicator shows poor performance, it is likely that the risk control system is ineffective in delivering the desired outcome.
Review the scope
Indicators should not be decided upon and then forgotten about. Every few years, the scope of the full set of indicators needs to be reviewed to ensure indicators still reflect the main process risks. Indicators may need to be changed because of:
■ introduction of new, high-risk processes;
■ improvement programs;
■ alteration in plant design;
■ reduction of staff/loss of competence in certain areas.
If reviews are not carried out, process safety indicators may become meaningless and the information collected may not give the necessary assurance to senior managers that the major hazard risks are under control.
Review tolerances
The importance of following up on
deviations from tolerances were highlighted in Step 4.4. However, it could be that the tolerance has been set at the wrong point, eg set too leniently/stringently, so the information or data does not adequately reflect reality. In such cases, the tolerance should be reviewed.
Tolerances should be reviewed – you don’t always get it the right first time!
Also Read: How Can Businesses Reach a Goal of Zero Incidents?
For more safety Resources Please Visit Safetybagresources