Fault tree analysis (FTA) is a graphical tool to explore the causes of system-level failures. It uses boolean logic to combine a series of lower-level events and it is basically a top-down approach to identify the component level failures (basic event) that cause the system level failure (top event) to occur. Fault tree analysis consists of two elements “events” and “logic gates” which connect the events to identify the cause of the top undesired event.
This Article will introduce the basics of Fault Tree Analysis (FTA). The Readers will demonstrate an understanding of Fault Tree Analysis principles.
Also Read .The Meaning of Safety Symbols

Background
Engineers developed FTA to improve the safety of missile systems. They reasoned most accidents/incidents result from failures or malfunctions within a system. A system consists of people, equipment, material, and environmental factors. This system per- forms specific tasks using prescribed methods. The components of a system and its environment are interrelated, and a failure in any part can affect the other parts.
A negative event can be a near miss or an incident that could have resulted in personal injury to an employee or equipment/ property damage.
Also Read: E-Books: System Safety Engineering and Risk Assessment
History of Fault Tree Analysis
Fault tree analysis is a top-down approach that was originally developed in Bell laboratories by H Waston and A Mearns for the air force in the year 1962. This concept was later adopted by Boeing and today it is widely used in aerospace, automobile, chemical, nuclear, and software industries, especially for reliability and safety-related events.
When Would You Use FTA
Fault tree analysis can be used to perform all types of system-level risk assessment processes. The purpose of FTA is to effectively identify the cause(s) of system failure and mitigate the risks before it occurs. This is an invaluable tool for complex systems that visually displays the logical way of identifying the problem. Moreover, system efficiency can be attained by this analysis.
Download: E-Books: Fundamentals of Process Safety Engineering
Analytical Trees
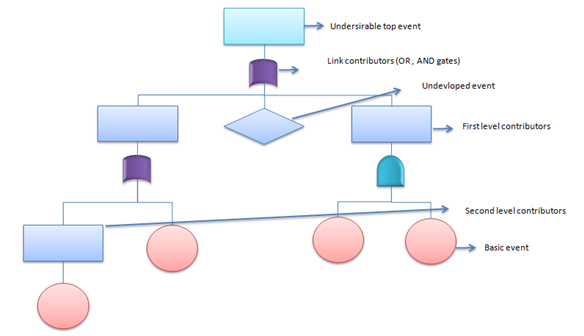
Analytical trees are graphic representations or pictures of a project or event. They use deductive reasoning in that they start with a general top event or output event and develop down through the branches to specific input events that must occur in order for the output to be generated. Analytical trees are called trees because their structure resembles a tree, narrow at the top with a single event symbol and then branching out as the tree is developed.
leading to the negative event being complete. Symbols are used to represent various events and describe relationships:

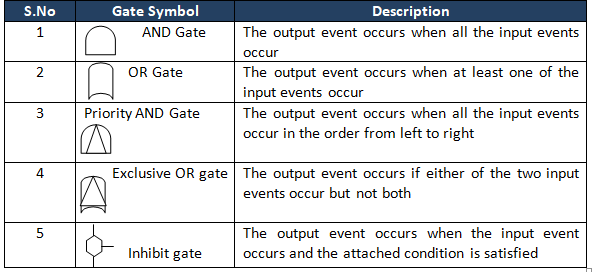

And gate – represents a condition in which all the events shown below the gate (input gate) must be present for the event shown above the gate (output event) to occur. This means the output event will occur only if all of the input events exist simultaneously.

Or gate – represents a situation in which any of the events shown below the gate (input gate) will lead to the event shown above the gate (output event). The event will occur if only one or any combination of the input events exists.
There are five types of event symbols:

1. Rectangle – The rectangle is the main building block for the analytical tree. It represents the negative event and is located at the top of the tree and can be located throughout the tree to indicate other events capable of being broken down further. This is the only symbol that will have a logic gate and input events below it.

2. Circle – A circle represents a base event in the tree. These are found on the bottom tiers of the tree and require no further development or breakdown. There are no gates or events below the base event.

3. Diamond – The diamond identifies an undeveloped terminal event. Such an event is not fully developed because of a lack of information or significance. A fault tree branch can end with a diamond. For example, most projects require personnel, procedures, and hardware. The tree developer may decide to concentrate on the personnel aspect of the procedure and not the hardware or procedural aspects. In this case, the developer would use diamonds to show “procedures” and “hardware” as unlevel-oped terminal events.

4. Oval – An oval symbol represents a special situation that can only happen if certain circum- stances occur. This is spelled out in the oval symbol. An example of this might be if switches must be thrown in a specific sequence before an action takes place.

5. Triangle – The triangle signifies a transfer of a fault tree branch to another location within the tree. Where a triangle connects to the tree with an arrow, everything shown below the connection point transfers to another area of the tree. This area is identified by a corresponding triangle that is connected to the tree with a vertical line. Letters, numbers, or figures identify one set of transfer symbols from another. To maintain the simplicity of the analytical tree, the transfer symbol should be used sparingly.
How do you do Fault Tree Analysis?
FTA involves the following steps:
- Define the top event.
- Know the system.
- Construct the tree
- Validate the tree
- Evaluate the tree
- Study tradeoffs.
- Consider alternatives and recommend action
Define the top event. To define the top event the type of failure to be investigated must be identified. This could be whatever the end result of an incident may have been, such as a forklift overturning.
Determine all the undesired events in operating a system. Separate this list into groups having common characteristics. Several FTAs may be necessary to study a system completely. Finally, one event should be established representing all events within each group. This event becomes the undesired event to study.
Know the system. All available information about the system and its environment should be studied. A job analysis may prove helpful in determining the necessary information.
Construct the fault tree. This step is perhaps the simplest because only a few symbols are involved and the actual construction is pretty straightforward.
Principles of construction. The tree must be constructed using the event symbols listed above. It should be kept simple. Main- train a logical, uniform, and consistent format from tier to tier.
Use clear, concise titles when writing in the event symbols. The logic gates used should be restricted to the gate and or gate with constraint symbols used only when necessary. An example would be the use of the oval constraint symbol to illustrate a necessary order of events that must happen to have an event occur. The transfer triangle should be used sparingly if at all.
The more the transfer triangle is used, the more complicated the tree becomes. The purpose of the tree is to keep the procedure as simple as possible.
Validate the tree. This requires allowing a person knowledgeable in the process to review the tree for completeness and accuracy
Evaluate the fault tree. The tree should then be scrutinized for those areas where improvements in the analysis can be made or where there may be an opportunity to utilize alternative procedures or materials to decrease the hazard
Study tradeoffs. In this step, any alternative methods that are implemented should be further evaluated. This will allow evaluators to see any problems that may be related to the new procedure prior to implementation.
Consider alternatives and recommend action. This is the last step in the process where corrective action or alternative measures are recommended
Example
Benefits The primary advantages of fault tree analyses are the meaningful data they produce which allows evaluation and improvement of the overall reliability of the system. It also evaluates the effectiveness and need for redundancy.
Limitation A limitation of the fault tree analysis is that the undesired event evaluated must be foreseen and all significant contributors to the failure must be anticipated. This effort may be very time-consuming and expensive. And finally, the overall success of the process depends on the skill of the analyst involved.

Minimal Cut Sets
One of the important factors in the qualitative analysis of fault trees is to identify a minimal cut set. For instance, complex and large fault trees have to use superior tools (algorithms for extraction) to get the minimal cut sets.
Cut set: A set of basic events that together cause the TOP undesirable event.
Ex: X, Y, and Z (from the below picture)
Minimal cut set: A cut set with a minimal number of events that can still cause the TOP undesirable event. In other words, the TOP undesirable event occurs if one or more minimal cut set occurs.
Ex: (X and Y); (X and Z) from the below picture

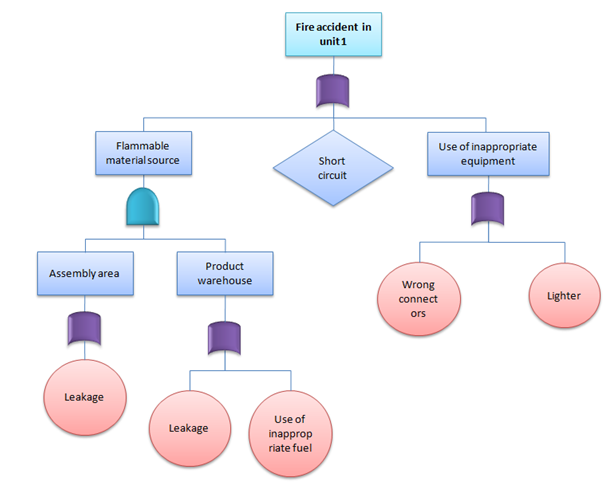
Practical Example of FTA
A fire broke out at unit 1 of XYZ cable manufacturing company despite a safety system in place. General Manager was very concerned about the accident and requested safety in charge to evaluate the system. However, as part of the initial analysis of the existing system, the safety team uses FTA to identify the different causes of accidents.
Quantitative Fault Tree Analysis
The top undesirable event occurs if one or more of the minimal cut sets occurs, hence the main target is to identify minimal cut sets. Moreover, if all the minimal cuts are independent of each other, then we could compute the probability of the top undesirable event by:
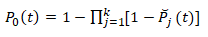
Where Pj is the failure probability of a minimal cut set
Example: Find the probability of water pump failure from the below example
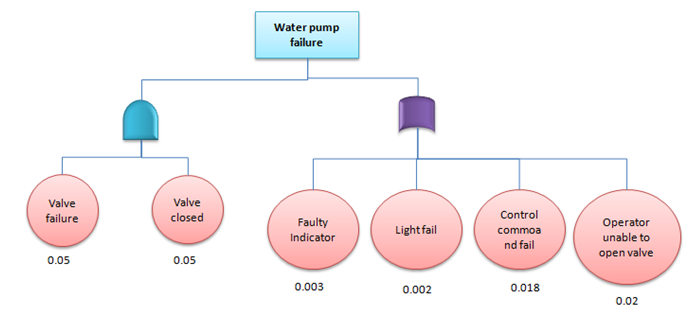
The water pump will fail because of value failure and value closed or fault indicator or light fail or control command fails or operator unable to open the valve. Since OR gates add and AND gates multiply the probability of pump failure
μpumpfail =1-(0.05*0.05)*(1-0.003)*(1-0.002)*(1-0.018)*(1-0.02) = 0.0448
Hence, the probability of water pump failure = 4.48%
Advantages of Fault tree analysis
- The fault tree visually depicts the analysis that will help the team to work on the cause of an event in a logical way that leads to failure
- Highlights the critical components related to system failure
- Provides an efficient method to analyze the system
- Unlike other analysis methods, human errors are also included in the analysis
- It helps to prioritize the action items to solve the problem
- Provides qualitative and quantitative analysis
Disadvantages of Fault tree analysis
- Too many gates and events to be considered for large system analysis
- The basic disadvantage is that it examines only one top event
- Common cause failures are not always obvious
- Difficult to capture time-related and other delay factors
- Needs experienced individuals to understand the logical gates
Please visit our Safety Resources SAFETY BAG to have many Safety Resources