Why do so many organizations continue to take a reactive approach to safety? Why is it so hard to maintain safety as a priority? Why do supervisors and managers who truly care about safety behave in ways that contradict their values? Remarkably, how we measure safety is a primary root cause for all of these problems. Incident rate, lost time rate, severity rate, and other lagging indicators are poor measures of safety. Such measures tell us how many people got hurt and how badly, but they do not tell us how well a company is doing at preventing accidents and incidents

One of the reasons they are a poor gauge of prevention is that these numbers have what statisticians call natural variation. In other words, it is a statistical fact that if the yearly number of unsafe conditions and unsafe behaviors were held constant, an organization could experience a different number of incidents during the first half of a year and the last half (or from one year to the next). Thus, the incident rate can get better or get worse with absolutely no change in safety conditions or behaviors. The result is that organizations, and departments within organizations, can go for long periods of time without accidents, despite having an unsafe work environment. By the very nature of it, this statistical fact works against keeping safety a priority. Managers and supervisors can do nothing around safety for a period of time and be reinforced with a good incident rate. Such is not the case for other business objectives like productivity, quality, reliability, etc. Those objectives tend to have much more sensitive measures and thus demand more constant management attention. In the context of these other important business objectives (and their powerful consequences), it is easy for the well-intended manager or supervisor to put safety on the back burner. When the incident rate is low, one can assume all is well with safety and, therefore, focus precious time on other priorities.
While there are many steps to build an effective safety culture, one where safety is truly a priority, a first step is to change the way safety is measured. While the incident rate is a necessary metric, it should be one of several. The majority of measures should be leading indicators that focus on proactive activities on the part of all employees—measures that track what people are doing daily to prevent accidents. With such measures in place, immediate and certain consequences can be engineered to ensure those activities occur. For example, companies that have a behavior-based safety process in place have frontline and management-level scorecards that track daily and weekly behaviors aimed at improving both safe conditions and safe behaviors. Daily and weekly accountabilities will raise safety to an equal playing field with other business objectives, thus helping to make safety a priority for all.
Evaluating the Effectiveness of Leading Indicators
The idea that shifting the focus to leading indicators will improve safety management is not new. Some organizations have made good strides toward creating leading indicators and reducing their dependence on lagging indicators. But the quality of the leading indicators is important. When it comes to measurement, we often choose the obvious or easy measure. For example, if we want a measure of safety training we track what percentage of employees attended essential training classes. While attending safety training is clearly a pre-requisite, just attending training doesn’t guarantee that workers truly learned what they need to learn to work safely on the job. Sadly, too often safety training becomes an opportunity to catch up on some sleep or day-dream about more interesting topics. Tracking attendance at safety meetings and job briefings suffer the same flaw. How do you know participants got anything out of the meeting? Most importantly, how do you know if they change their behavior on the job to work more safely?
Even the behavior-based safety measures that organizations choose to focus on are often the least meaningful. The tracking of the number of observations completed provides interesting information, but if that is the only measure of your BBS process then you are missing the most critical information. What has improved as a result of your BBS system?
If we are going to take the time to create leading indicators of safety then we should take the time to make those metrics meaningful and impactful. The following criteria can be helpful in guiding you toward better metrics.
Leading indicators should:
- Allow you to see small improvements in performance
- Measure the positive: what people are doing versus failing to do
- Enable frequent feedback to all stakeholders
- Be credible to performers
- Be predictive
- Increase constructive problem solving around safety
- Make it clear what needs to be done to get better
- Track Impact versus Intention
The last criterion is important. Always ask yourself: what are we trying to accomplish with this component of our safety system? Then ask if your metric is assessing whether you accomplish what you set out to do. Are you measuring the impact or just good intention?
Finding the Perfect Measures
There is no such thing as a perfect measure, so don’t waste time trying to find or create one. Our advice is to use good criteria (like the ones above) to create some measures and then start using those measures. Over time you can improve them to best meet your needs. To get you started, here are some examples of better leading metrics. While not perfect, they do focus more on impact than their more-traditional counterparts. Safety Training. A better measure than attendance is the number of people that can perform tasks they have been trained in on the job with some level of fluency.
Safety Audits. Rather than just measuring that audits are done, track the percent of corrective action items (coming out of the audits) that have been completed.
Behavior-Based Safety. In addition to the number of observations, track the percent of safe behavior, number of safe habits, and improvements in leadership behaviors. In our BBS process leading indicators to include the number of safe habits developed and the number of hazards identified and remediated as part of the observation process.
Safety Meetings. The effectiveness of safety meetings can be evaluated by establishing 3-5 criteria for effective meetings (what does a good safety meeting look like?) and periodically having meeting participants rate the meeting against those criteria. The criteria should include participation in some way.
Impact-orientated leading indicators like these may take more time to create, however they will ultimately drive more of the desired behavior. We all know too well that poor measures can drive undesired behavior. Under-reporting to achieve a better recordable rate and pencil whipping audits or observations to increase the number completed are just two examples.
Making Leading Indicators Work
A familiar saying is: “what gets measured gets done.” As we have just argued, what we measure is important because it sets the stage for what people do. However, it is not completely true to say what gets measured gets done. Many of us routinely measure our weight and don’t do anything to improve it. Similarly, many of us measure our speed (with our car speedometer) and don’t drive the speed limit. In truth, it is not what gets measured that gets done; it is what gets consequences that get done. Proactive safety activities must be reinforced if they are to persist. A positive accountability system that holds people accountable for the leading indicators will ensure safety targets are met.
Accountability is about consequences. The default form of accountability is negative reinforcement. People do what they need to do to meet the targets and avoid the bad consequences that might happen if they don’t, such as the boss being upset, peers being disappointed, and/or looking like you aren’t doing your job. Positive accountability is about ensuring that desired behavior receives positive reinforcement. No workplace will be completely devoid of negative reinforcement, nor should it be. However, the balance of behavioral consequences should be heavily skewed in favor of positive ones, because that is the only way to create a workplace where discretionary effort characterizes the entire culture.
Accountability does require measurement, and the metrics we use help shape what happens. But keep in mind, the measures are less important than the discussion around what was done to achieve the measures (i.e., the behaviors) and on-going assessment of impact.
Frequent, brief conversations about the leading indicators at all levels of the organization are key to improvement. Frequent conversations establish safety activities as priorities and allow real-time coaching for improving performance. The focus on impact ensures the activities are truly driving safety results and are therefore worth the time and effort. The focus on impact also helps performers see the small improvements they might otherwise not attend to; thereby helping them come into contact with the natural reinforcers of their efforts.
Many positive accountability methodologies are available. The point is to make sure you have an effective process that supports ongoing improvement.
Sound like a lot of work? It is initially, but like anything else, it becomes habitual over time. No one said safety was easy, but who could argue it’s not worth it?
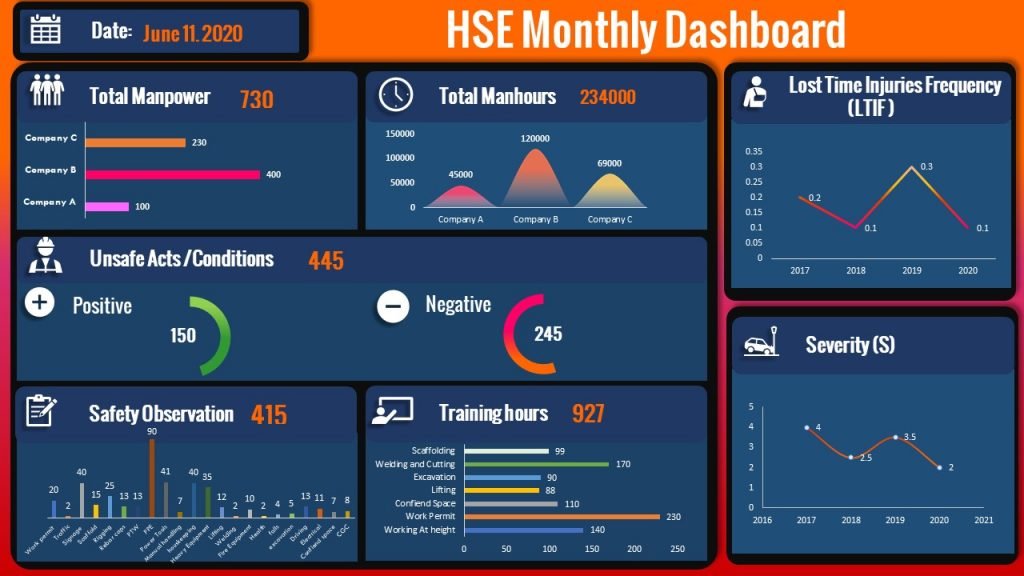
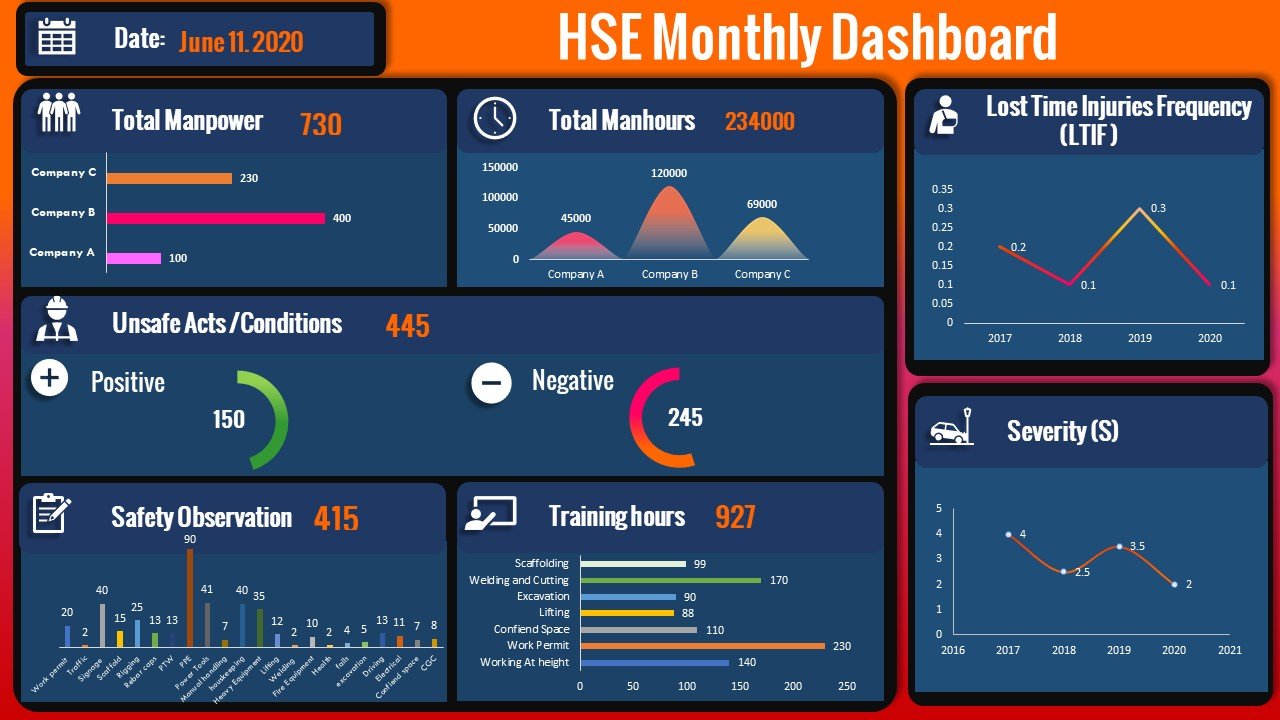
Learn how to Create Automated Safety Dashboard
In This Video tutorial, you will learn how to create Automated Safety KPI Dashboards using Powerpoint slide linked to excel backend Datasheet the Dashboard showing an example of Safety KPI’s and records on monthly basis and it’s easy to edit and can be downloaded
To Download the Dashboard click Here


